-1
我有兩個3-D數組,其中一個包含數據,另一個包含元數據。所述元數據是日期簽名,所以可以與產生的示例如下:使用類似數組中的數據過濾3D陣列
datamatrix <- array(data = c(rep(0,9), rep(0,9),(sample(0:100, 9)/1000), (sample(30:50, 9)/100), (sample(70:80,9)/100), (sample(30:50,9)/100), rep(0,9), rep(0,9)), dim = c(3,3,8))
timematrix <- array(data = c(sample(1:20), sample(30:50, 9), sample(70:90, 9), sample(110:130,9), sample(150:170,9), sample(190:210,9), sample(230:250,9), sample(260:280,9)), dim = c(3,3,8))
我希望構造充滿來自第一矩陣(datamatrix)的數據的新的3D陣列和一堆NA的使得在datamatrix元件i在最終workingdata 3D陣列,像這樣落入相應的日期(從相應的元數據中timematrix導出):
workingdata <- array(data = NA,
       dim = c(3,3,365))

for (i in 1:length(datamatrix)){
    location <- i
    locationguide <- location%%9
    locationfinal <- locationguide%%3
    if (locationfinal == 0){
    a <- 3
    b <- 3
    }
    if (locationfinal == 1){
    a <- 1
    b <- 1
    }
    if (locationfinal == 2){
    a <- 1
    b <- 2
    }
    if (locationfinal == 3){
    a <- 1
    b <- 3
    }
    if (locationfinal == 4){
    a <- 2
    b <- 1
    }
    if (locationfinal == 5){
    a <- 2
    b <- 2
    }
    if (locationfinal == 6){
     a <- 2
     b <- 3
     }
    if (locationfinal == 7){
    a <- 3
    b <- 1
    }
    if (locationfinal == 8){
    a <- 3
    b <- 2
    }
    value <- datamatrix[i]
    day <- timematrix[i]
    workingdata[a,b,day] <- datamatrix[i]
}
我正在使用該數據集是千寬列的和equ長度非常長。當前的方法可以完成這項工作,但是在實際的數據中會永久使用for循環,並且由於所需的if全部都需要,所以編碼會很荒謬。有沒有人知道一個更好的方法來過濾這樣的數據?
對於我想要的觀衆友好的理念,從ESRI最佳的圖像概括起來: http://pro.arcgis.com/en/pro-app/tool-reference/space-time-pattern-mining/GUID-42A31756-6518-41E9-A900-2C892AF4023A-web.png
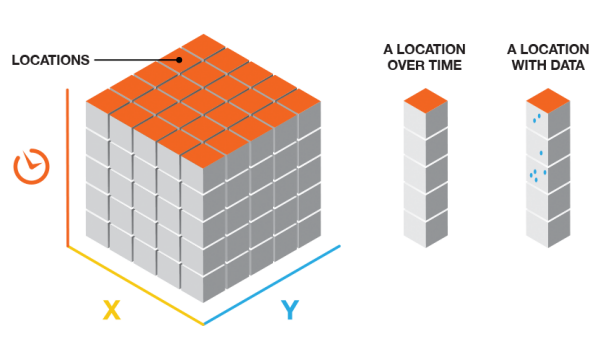
我每天,在觀察拍攝的z維時間,一個塊在z軸上落入其適當的行中,但仍保留在x和y維度的原始位置。
所以'datamatrix'和'timematrix'是數組? – Axeman
我不太確定你的'if'語句系列中的啓發式。也許你可以詳細說明一下? – shayaa
爲什麼'timematrix'中有'0'? 'workingdata'是否從第0天開始,在第1行開始? – Axeman