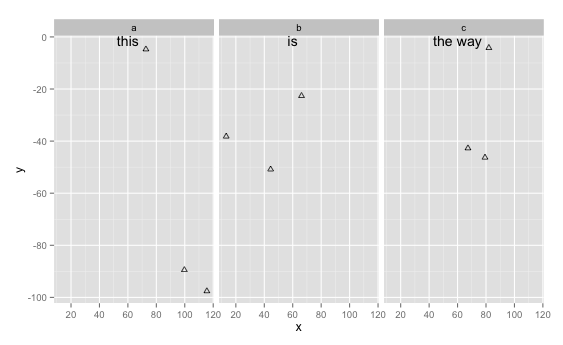
我只是想爲ggplot2生成的每個數字面板添加註釋; (a),(b),(c)等簡單的標籤。有沒有簡單的方法來做到這一點?ggplot2:geom_text()with facet_grid()?
回答
來源:https://groups.google.com/forum/?fromgroups=#!topic/ggplot2/RL8M7Ut5EpU您可以使用以下方法:
library(ggplot2)
x <-runif(9, 0, 125)
data <- as.data.frame(x)
data$y <- runif(9, 0, 125)
data$yy <- factor(c("a","b","c"))

ggplot(data, aes(x, y)) +
    geom_point(shape = 2) +
    facet_grid(~yy) +
    geom_text(aes(x, y, label=lab),
     data=data.frame(x=60, y=Inf, lab=c("this","is","the way"),
      yy=letters[1:3]), vjust=1)
這應該給你:

+1,但是你能否提供更多的上下文來了解它的工作原理?現在它只是一段代碼和一張圖片。 – 2013-04-07 20:30:09
當然。基礎'ggplot'調用具有數據框和'geom_point''facet_grid'構面的實際繪圖數據。關鍵是爲'geom_text'設置一個新的數據框(在代碼片段中動態創建,但可以在'ggplot'塊外部創建並引用數據框),並將標籤元素的數量與方面的數量。您可以對'geom_text'使用多次調用,以在各個構面之間放置多個不同的標籤。他們會被依次引用,所以要注意這一點。 – hrbrmstr 2013-04-07 20:53:12
如果您想要繪製多個標籤,則不需要多次調用geom_text,只需將行添加到具有適當文本和facet_grid變量的data.frame。 – 2013-04-07 21:06:20
基本上,您將創建一個data.frame,其中包含帶文本的列的文本以及包含用於facet_grid的變量的列。然後,您可以簡單地將geom_text與data.frame相加。請參閱geom_text的文檔以獲取關於文本放置等的更多詳細信息。
- 1. ggplot2 coord_flip()with geom_text
- 2. ggplot2:geom_violin(),geom_text()with facet_grid()打印每個因子中的總行數,不包括NA
- 3. 使用ggplot2在ggplot2中的多個facet_grid中的良好geom_text質量
- 4. GGplot2的最小尺寸geom_text()
- 5. ggplot2 dotplot with facet_grid with top ala facet_wrap(但是w/space =「free_x」)?
- 6. 盒裝geom_text與ggplot2
- 7. [R GGPLOT2 facet_grid問題
- 8. ggplot2,facet_grid,自由秤?
- 9. 錯誤與GGPLOT2 facet_grid
- 10. R ggplot2箭頭與geom_text
- 11. 對齊geom_text到geom_vline在GGPLOT2
- 12. ggplot2 facet_grid排列面板
- 13. ggplot2柱狀圖與facet_grid
- 14. R - ggplot2:geom_text的位置不起作用
- 15. ggplot2 facet_wrap geom_text不接受日期值
- 16. 使用ggplot2左對齊geom_text圖層
- 17. ggplot2中的geom_text()大小定義
- 18. ggplot2中geom_text的相對位置?
- 19. ggplot2-geom_linerange with stat_smooth
- 20. facet_grid ggplot2 panel.margin顯示不正確?
- 21. ggplot2 drop = FALSE與facet_grid不一致
- 22. 在facet_grid(ggplot2)中包裝一個維度
- 23. GGPLOT2:改變strip.text位置facet_grid情節
- 24. ggplot2:geom_pointrange()facet_grid()與coord_flip()和自由標度
- 25. 如何在ggplot2中正確使用facet_grid?
- 26. R/GGPLOT2 - 上facet_grid重疊標籤
- 27. 旋轉開關小標籤在GGPLOT2 facet_grid
- 28. ggplot2 facet_grid()更改背景顏色
- 29. 在ggplot2中自定義facet_grid中的ymax
- 30. R ggplot2 facet_grid規模和空間
你有一個圖片作爲一個例子,你可以發佈? – 2013-04-07 20:14:22
對不起,我需要弄清楚如何發佈圖片... – hatmatrix 2013-04-07 22:02:29